Give the right stories a closer look.
See how articles are performing in the context of their placement. Use popularity, clicks and CTR to decide what to investigate before your next homepage update.
Smart Overlay
See how stories perform, what keeps readers exploring, and how personalisation contributes. Smart Overlay brings the numbers directly onto your website.
A browser extension for your editorial team
A closer look
Scan the page, investigate a story, or step back to see the overall performance. The context stays with you.
01 / On-page signals
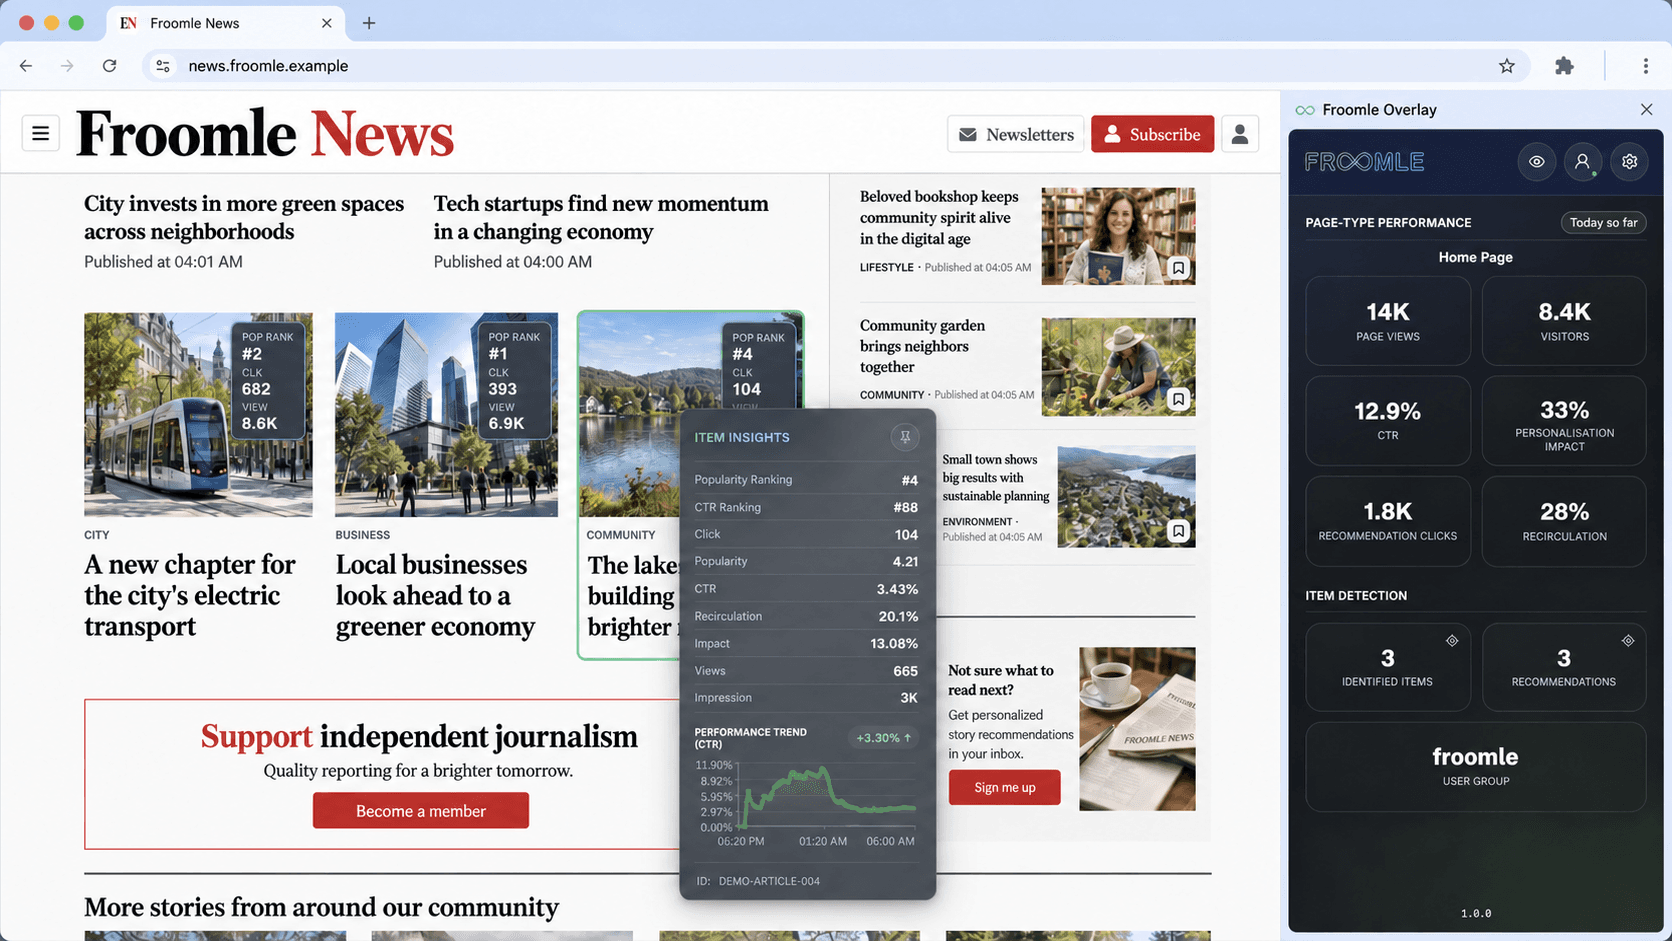
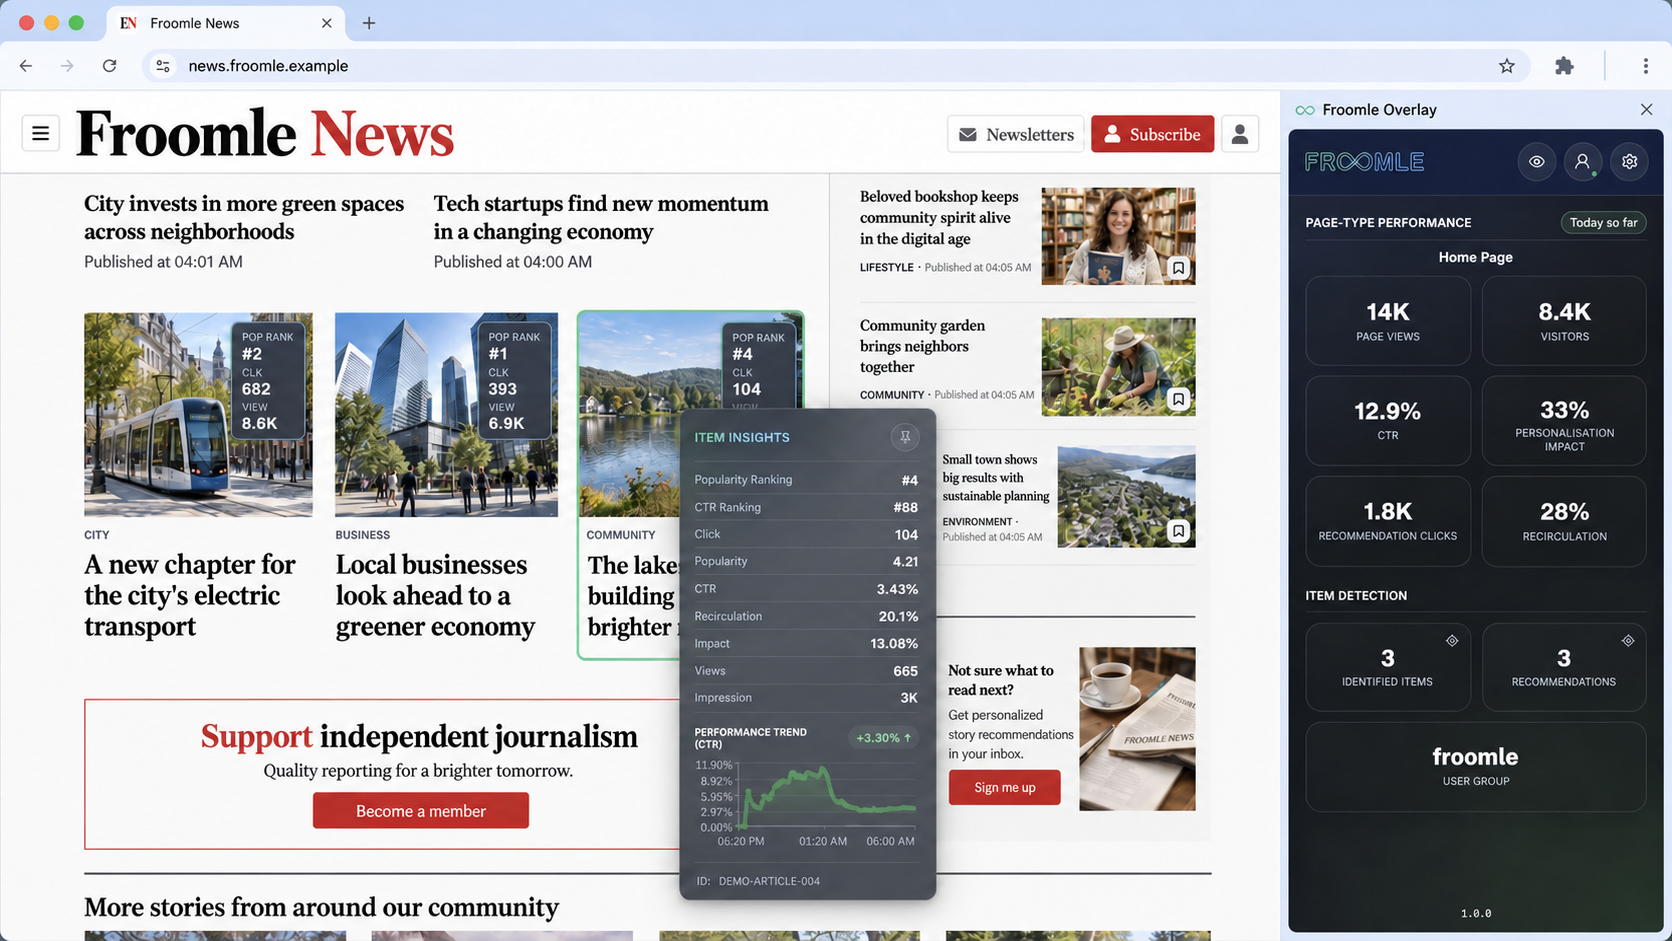
Popularity rank, clicks and views sit on the article itself. Scan the page and see the response to a story alongside its headline, image and placement.
Use it to decide which stories deserve a closer look before your next homepage update.
In this example
The transport story has 682 clicks and 8.6K views. Its #2 popularity rank helps you place that response in context.
02 / Article insights
Open an article’s insights to see its click-through rate (CTR), impressions and performance trend. Recirculation shows how it helps readers continue to another story.
Use it to inform your next decision about an article’s visibility or presentation.
In this example
This story is #4 by popularity and #88 by CTR. The two rankings give your team a reason to look more closely at its performance.
03 / Page performance
See page views, visitors and CTR alongside recommendation clicks, recirculation and personalisation impact. The side panel keeps the overall picture visible while you explore the page.
Use it to bring editorial, audience and product teams into the same performance conversation.
In this example
The “Today so far” view brings traffic, engagement and personalisation into one summary. These sample figures illustrate the view on your publication.
Built for the daily editorial meeting
Put performance next to the journalism. Give every team a clearer starting point for the decisions they already make.
Homepage editors
See how articles are performing in the context of their placement. Use popularity, clicks and CTR to decide what to investigate before your next homepage update.
Audience teams
Bring recirculation and performance trends into the conversation. Understand which stories attract attention and which help readers continue exploring your journalism.
Editorial & product leads
See recommendation clicks and personalisation impact alongside the page itself. Give editorial, audience and product teams a shared view of content discovery.
The numbers inform the decision. Your team brings the editorial judgment.
In your workflow
Keep your publication in view as you move from observation to action.
Start on your Froomle-connected website, with your stories and their actual placement in view.
Use the browser extension to bring article indicators and the page-performance panel into your editorial view.
Inspect a story, make an informed editorial decision, and return to see how its performance develops.
Article badges show popularity rank, clicks and views. Article insights add CTR, recirculation, impressions, impact and a performance trend. The page overview brings together traffic, engagement and personalisation metrics for the selected period.
The overlay is an editorial view in the browser where the extension is active. It adds performance information for your team. Publishing and presentation decisions stay in your existing workflow.
Smart Overlay brings recommendation clicks, personalisation impact and recirculation into the same view as article and page performance. Your team can discuss how content discovery is performing while looking at the publication itself.
Book a demo to discuss your publication, tracking and editorial workflow. We’ll walk through the relevant metrics and the setup for using Smart Overlay on your website.
Smart Overlay by Froomle
Let’s explore what your team could see on your own publication.